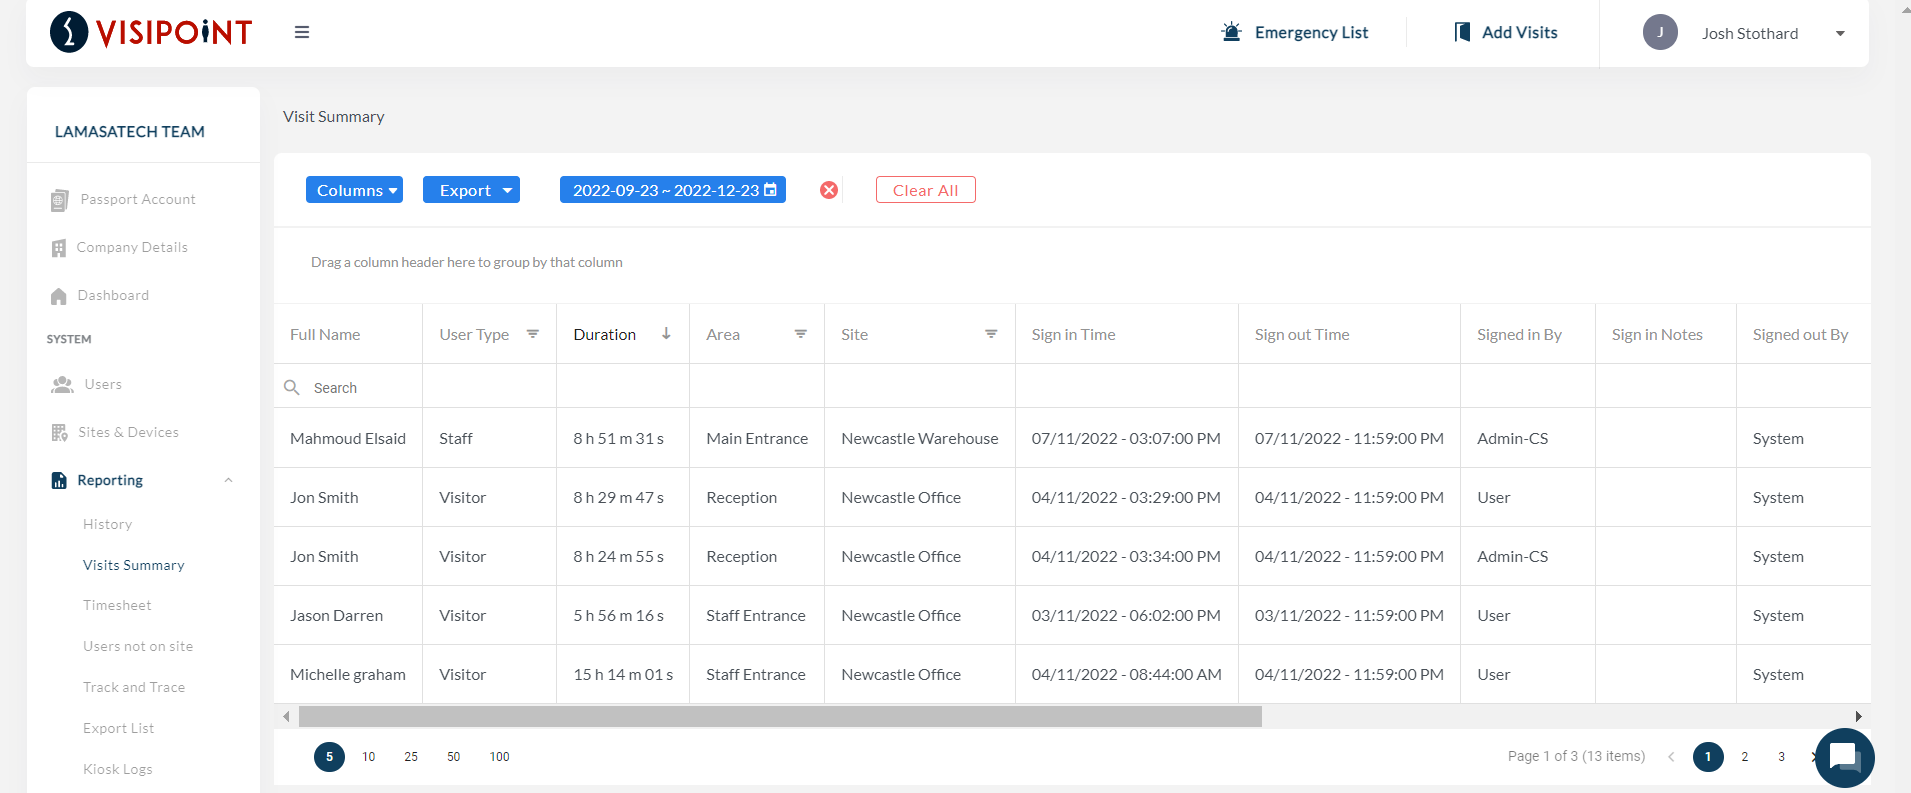
The Visit Summary report provides a report of your visits with an automatic calculation of duration for each user record (time spent on site/hours worked). This is limited to a 3-month period. For longer reports or to generate reports based on specific criteria, please use the Timesheets report instead.
Accessing the Visit Summary report
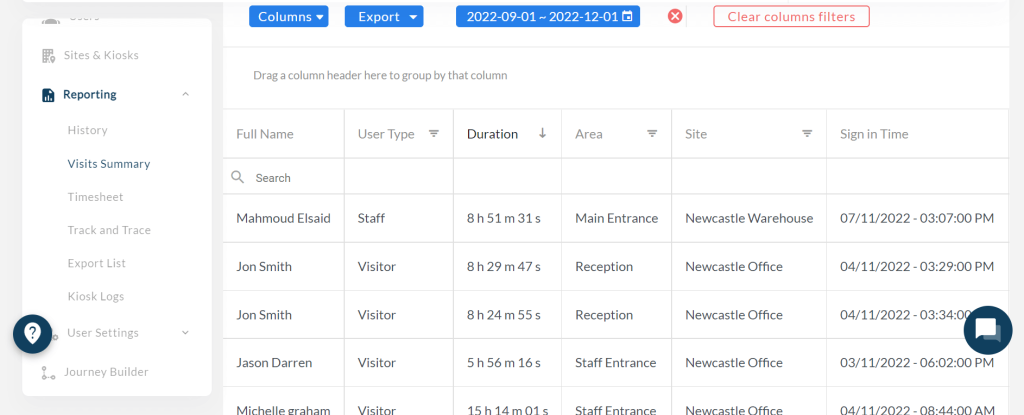
You can find the Visit Summary feature in the Reporting tab in the left side menu.
Selecting this option will direct you to a grid which shows the users who have signed in at any of your sites or areas and the duration of their visit.
You can export this data as an Excel or CSV file via the “Export” dropdown button.
Learn more about the other reports available in this article.
Visit Summary Grid
In the Visit Summary grid, you will be able to view:
- The duration of completed visits for your users
- The duration of ongoing visits for users who have not signed out yet
The data shown by default will be from today’s date. You can change this by clicking on the date above the grid. A calendar will then appear allowing you to select a date range for the data. The maximum range that you can select is any 3-month period.
You can choose what data is shown in the Visit Summary by selecting the Columns dropdown and ticking the options you want to appear and unticking those you do not wish to see. The columns you can choose from are:
- Full Name
- User Type
- Sign-in time
- Sign-out time
- Duration
- Site
- Area
- Signed in By
- Sign in Notes
- Signed out By
- Sign-out Notes
- Company
- Email Address
- Phone Number
- Vehicle Registration
- RFID
Filtering Data
Once you have selected the columns you want to see, you can filter the data by clicking on any of your columns. Clicking once will arrange the data in ascending order based on that column and clicking twice will organise the data in descending order.
Full Name, Company, Email Address, Phone Number, Vehicle Registration and RFID all have a search option under their column header. Using this, you can search for specific users by typing in their details. As you type the data will begin to be filtered based on what you have entered so far.
For some columns, you will see a downward arrow. These columns allow you to select from a drop-down, such as which user types to show or which areas.
The “Clear columns filters” button will remove your filter options and reset the date to today.
Grouping Columns
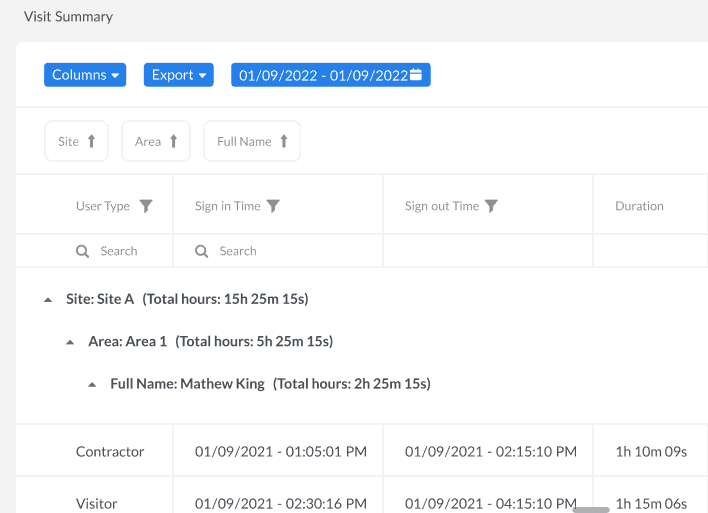
You can group different columns of the data displayed by dragging the column headers into the space at the top of the report under the blue filters. It is labelled “Drag a column header here to group by that column”.
This creates a dropdown menu based on the order you arranged for your group. For example, adding Site, Area and Full name to your group will give you a dropdown selection for your sites. Clicking your desired site will open the list of areas for that site. Choosing an area will then display a list of users who signed in during the date range you have selected. You can then click any of the names to view the visit data for that user.
Next to each dropdown in the group is a figure showing the total amount of time users were signed in during your selected date range.
Your group, as well as the order of your columns, are saved as you edit them. The next time you return to the Visit Summary the layout of your data will be as you left it.


